Today’s article was written by Johni Edsel of Tulsa Technology Center
EDITOR’S NOTE: Although this article mentions former standards, the value of the article is still relevant.
As a math teacher, I’m always looking for ways to make my lessons make “sense” to my students. Sometimes it’s hard to determine if my students understand what they are actually doing. Yes, they can “plug and chug”. Yes, they can manipulate an equation to solve for a certain variable. Yes, they can graph a linear or quadratic equation (most of the time). What does that tell me? It tells me that I did a pretty good job of selecting problems for their homework assignment that were close to the examples that we worked together in class. Students like that. I like that. It’s easy. I always thought that I was a good math teacher because I was able to get my students to mimic me, which meant, “Think like me and solve problems like me”.
Now that common core has arrived I have had to become a different type of teacher. It’s more than just being able to solve a problem but now I realize that I need my students to understand why and how they are able to do what they do and if the answer they get is reasonable.
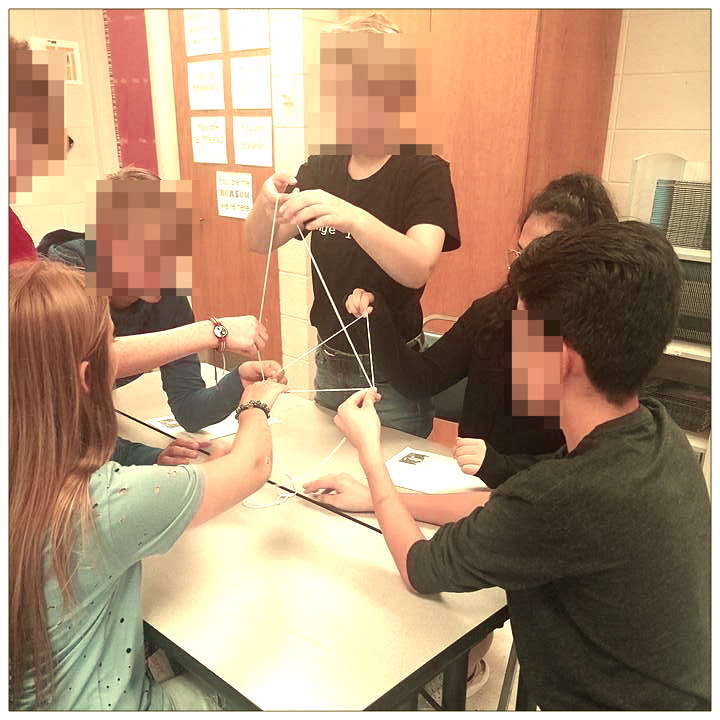
I am trying to incorporate a more hands on approach in my class. I have been able to do this by doing a flipped classroom. This has allowed my students to watch the lecture at home which frees up class time to work on assignments and activities. I am including one activity that my Algebra class did when we were studying systems of equations. The activity went very well and I am definitely planning on using it again. I liked that the activity incorporated measuring, graphing, finding the equation of the line of best fit, and then writing about their answers. They had to understand what the y-intercept, the point of intersection, and the slope all represented.
The students worked in groups of three and the activity took approximately 75 minutes to complete. Here are some of the things that I observed when my students were working:
*Some students had graphs that never intersected. This led to great discussion about possible errors: Did they measure incorrectly? Did they graph incorrectly? Was there a mistake at all?
* Question #5 asked the students to physically prove their answers for #3 and #4. I liked this because they had found their answers by looking at the graph that they had plotted. They then needed to prove that answer by using their two different ropes. They could actually “see” their answer.
*Students solved this problem by using all of the techniques that are required for an AP Calculus class. (GNAW) They had to solve Graphically, Numerically (the table), Algebraically, and Written.
Overall, this activity was well worth the time spent in class.
***This activity was NOT my creation. I received it from a co-worker who received it at a summer OGAP workshop. I also think some form of it has also appeared in the Mathematics Teacher magazine.
Bio: Johni Edsel is in her 19th year of teaching. She spent 15 years teaching in public school and is now in her 4th year at Tulsa Technology Center. She teaches AP Calculus AB, Pre-Calculus, and Algebra II.


